DevOps Journey: Log Shipping
Explore Log Shipping with FileBeat
On my journey in the DevOps cultural revolution, like many, has been heavy on the automation. This started with change configuration platforms (Chef, Puppet, Ansible, Salt Stack), infrastructure as code (Ansible, Terraform), and immutable infrastructure (Docker, Kubernetes).
However automation was only one the aspects in DevOps.
DevOps Models
In DevOps model called CAMS (Damon Edwards), which was augmented later to become the CALMS model (Jez Humble), here are the aspects including automation:
- Culture (or Collaboration)
- Automation
- Lean
- Measurement
- Sharing
One area that I found vital yet often neglected is measurement, and so in my DevOps journey, I wanted to devote some energy toward this endeavor.
Measurement
The measurement aspect includes a technical component called observability. This can be organized into BlackBox Monitoring (polling, uptime, monitoring) and WhiteBox Monitoring (metrics, logs, traces).
BlackBox monitoring includes tools like Nagios, Monit, Ganglia, or Icinga. In WhiteBox monitoring, these are some popular OSS platforms:
- Metrics: collectd, Graphite, TICK (Telegraf-InfluxDB-Chronograf-Kapacitor), Prometheus, Thanos, Cortex, Metricbeat
- Logging: ELK (ElasticSearch-Logstash-Kibana), EFK (ElasticSearch, Fluentd or Fluentbit, Kibana), PLG (Promtail-Loki-Grafana), Graylog, Filebeat
- Tracing: Zipkin, Jeager, Tempo
Logging: Where to Start?
I wanted to explore the area of logging with the ELK Stack. One particular tool that captured my interest is FileBeat, a light weight log shipper built around the Beats library written in Go. The purpose of a log shipper is to get logs and send it somewhere, so this small tool seemed ideal.
My goal is to fetch logs from from docker containers of my target application and view the logs in Kibana. Normally, logs would be sent to Logstash, but for this exercise, I will send them directly to ElasticSearch.
The target application is Dgraph, a high speed open-source transactional, distributed graph database. I picked Dgraph because I wanted use a cluster, where many cluster nodes make up a single service, and so these cluster nodes need to be monitored, and graph databases are all the rave now, with Dgraph being the hottest one out there.
Configuring Docker Environment
The easiest way to run Docker containers as part of a set is Docker Compose. Below is a docker-compose.yml configuration for five services that make up Dgraph and ELK Stack:
This can only be directly run on Linux, as file paths and unix socket will not be accessible from a Windows 10 or macOS system using Docker Desktop.
You can get started by running the following:
# create defaults
cat <<-EOF > .env
ELASTIC_VERSION=7.12.0
DGRAPH_VERSION=v20.11.2
EOF# launch ElasticSearch and Kibana
docker-compose up --detach elasticsearch
docker-compose up --detach kibana# launch Dgraph services
docker-compose up --detach zero
docker-compose up --detach alpha
Note: Since the time this article was written, a new version of Dgraph was released. This new release v21.03.0 has new features for audit logs and multi-tenancy. The command line options also have since changed, so if you use later versions, consult the documentation for the appropriate configuration options.
Configuring FileBeat
For FileBeat, you can download this filebeat.yml configuration:
This configuration will use auto-discovery feature and enrich the data with Docker metadata. It will harvest logs from /var/lib/docker/containers.
When Kibana is available, you can launch FileBeat:
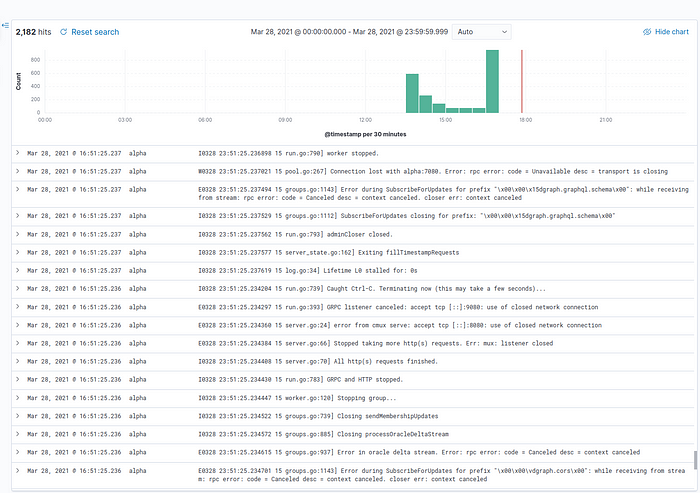
docker-compose up --detach filebeatAfterward you can navigate to Analytics→Discover and explore the filebeat-* data. Below is an example of selecting fields @timestamp , container.name, and message.
The Next Step: Ingest Pipeline
As ElasticSearch is about, well, searching, it would be nice to break apart the log message string into pieces, so that they can be searched, such as errors and warnings. Dgraph uses a golang glog format. Normally, this is done with a tool like Logstash or Fluentd, but we can use ingest pipelines for this.
The ingest pipeline has processors that can manipulate the data, where you can fetch a full list using curl and jq:
ES="http://localhost:9200"
HTTP_PATH="_nodes/ingest"
PARAM="filter_path"
VALUE="nodes.*.ingest.processors"curl --silent --request GET "$ES/$HTTP_PATH?$PARAM=$VALUE" | \
  jq -r '.nodes | .[].ingest.processors | .[].type' | column -c 100
Ingest Pipeline
Below is an example ingest pipeline using the grok processor to break up the golang glog log messages into pieces:
With this file saved as glog_pipeline.json, you can upload the pipeline using this:
curl --silent \
  --header 'Content-Type: application/json' \
  --request PUT \
  --data @glog_pipeline.json \
  http://localhost:9200/_ingest/pipeline/glog-pipeline'
You should get a result of {"acknowledged":true}. After this step, edit the filebeat.yml config and un-comment the line that has pipeline: glog-pipeline.
Now we restart FileBeat:
docker-compose restart filebeatTo create some traffic, we can delete Dgraph nodes and recreate them:
docker-compose stop alpha && docker-compose rm alpha
docker-compose stop zero && docker-compose rm zerodocker-compose up --detach zero
docker-compose up --detach alpha
Viewing Results in Kibana
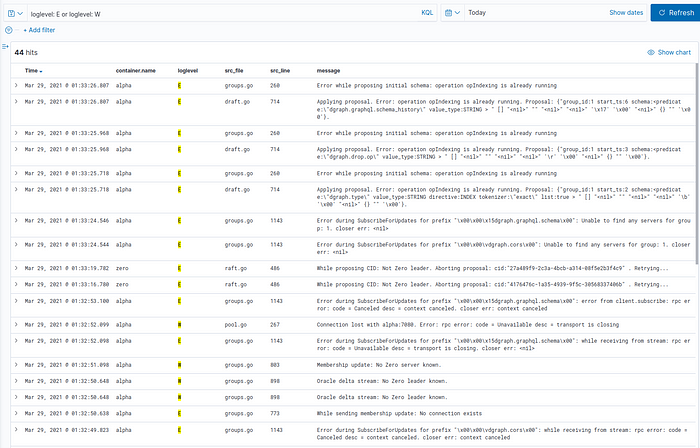
We should be able to select new fields, such as loglevel, src_file, src_line, and updated message. We can also filter on only errors and warnings with loglevel: E or loglevel: W.
Conclusion
This is just the beginning of the journey, there are so many things we can explore with the data above, such as:
- Using more ingest pipeline processors to reshape and enrich data
- Loading data into Dgraph, such as adding millions of predicates with live loader and monitoring or finding events of interest.
- Setting up alerting on appropriate log messages that may indicate something more serious.
Also, beyond Docker, the real test is to deploy this on Kubernetes, and use FileBeat auto-discovery for Kubernetes metadata. We can also explore other log shippers, like Fluentbit, Fluentd, or Logstash, or use the same log shippers to send to Loki and visualize the results in Grafana.
Besides FileBeat, there are other Beats that can be used to collect metrics or other data. Besides Beats, Logstash has input plugins that can capture a variety of data too.
The possibilities and options around countless. Enjoy.